

- Why Does Volatility Matter Anyway?
- How to Read Market Volatility
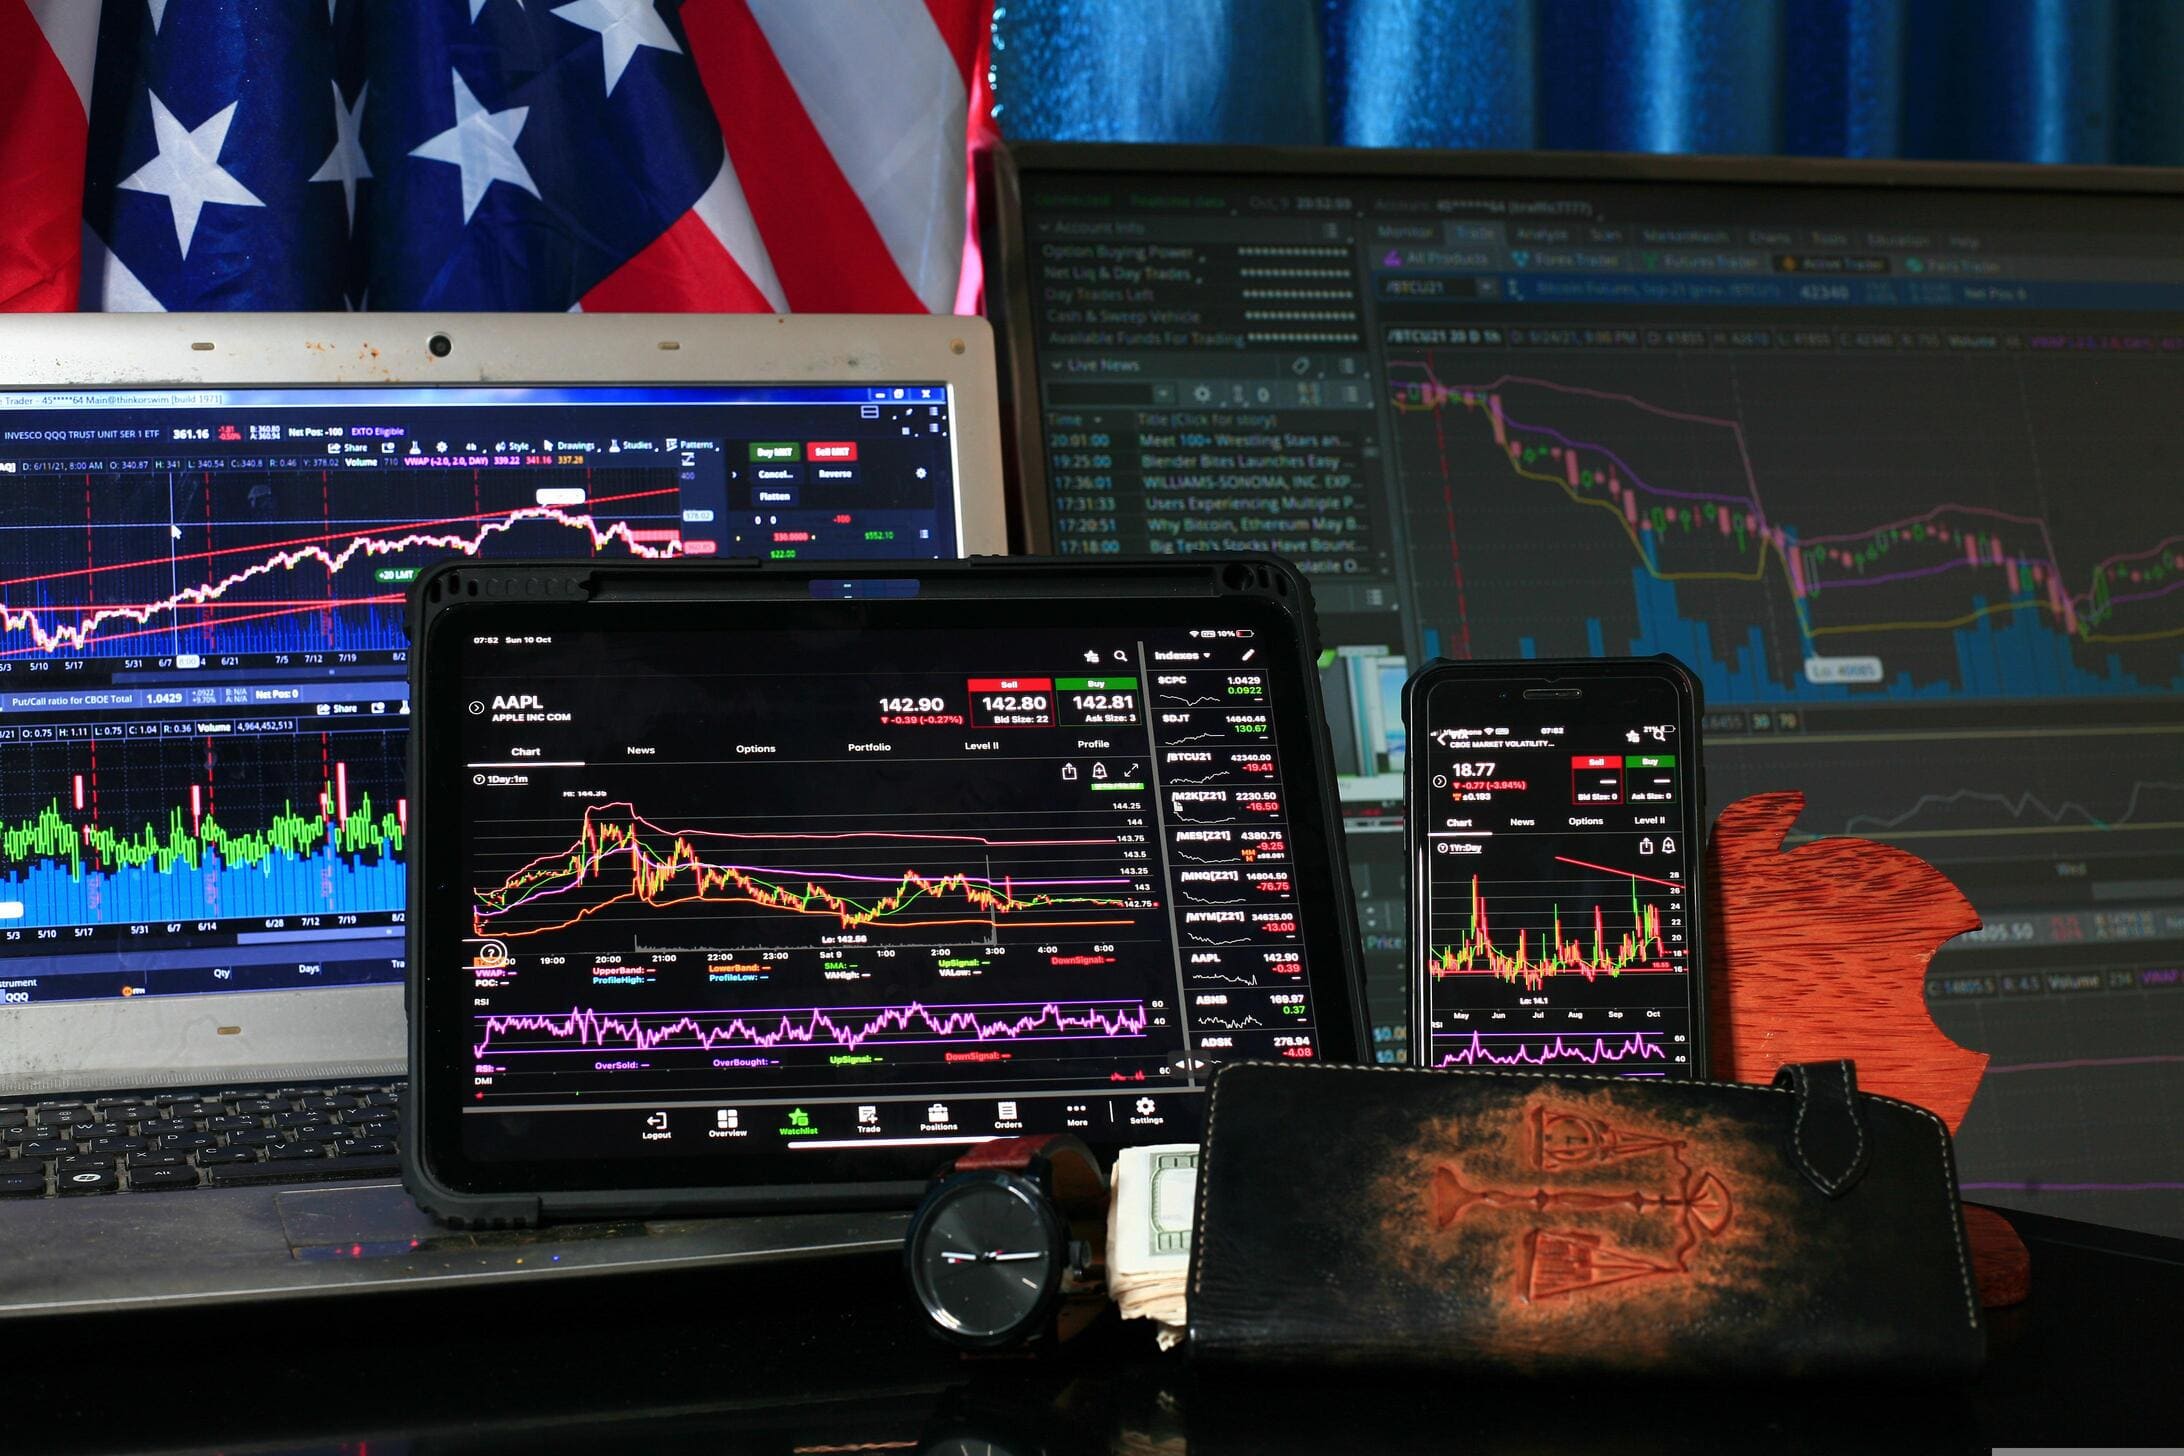
- 1. Technical Analysis
- Top-Down Analysis
- Technical Indicators
- Historical volatility
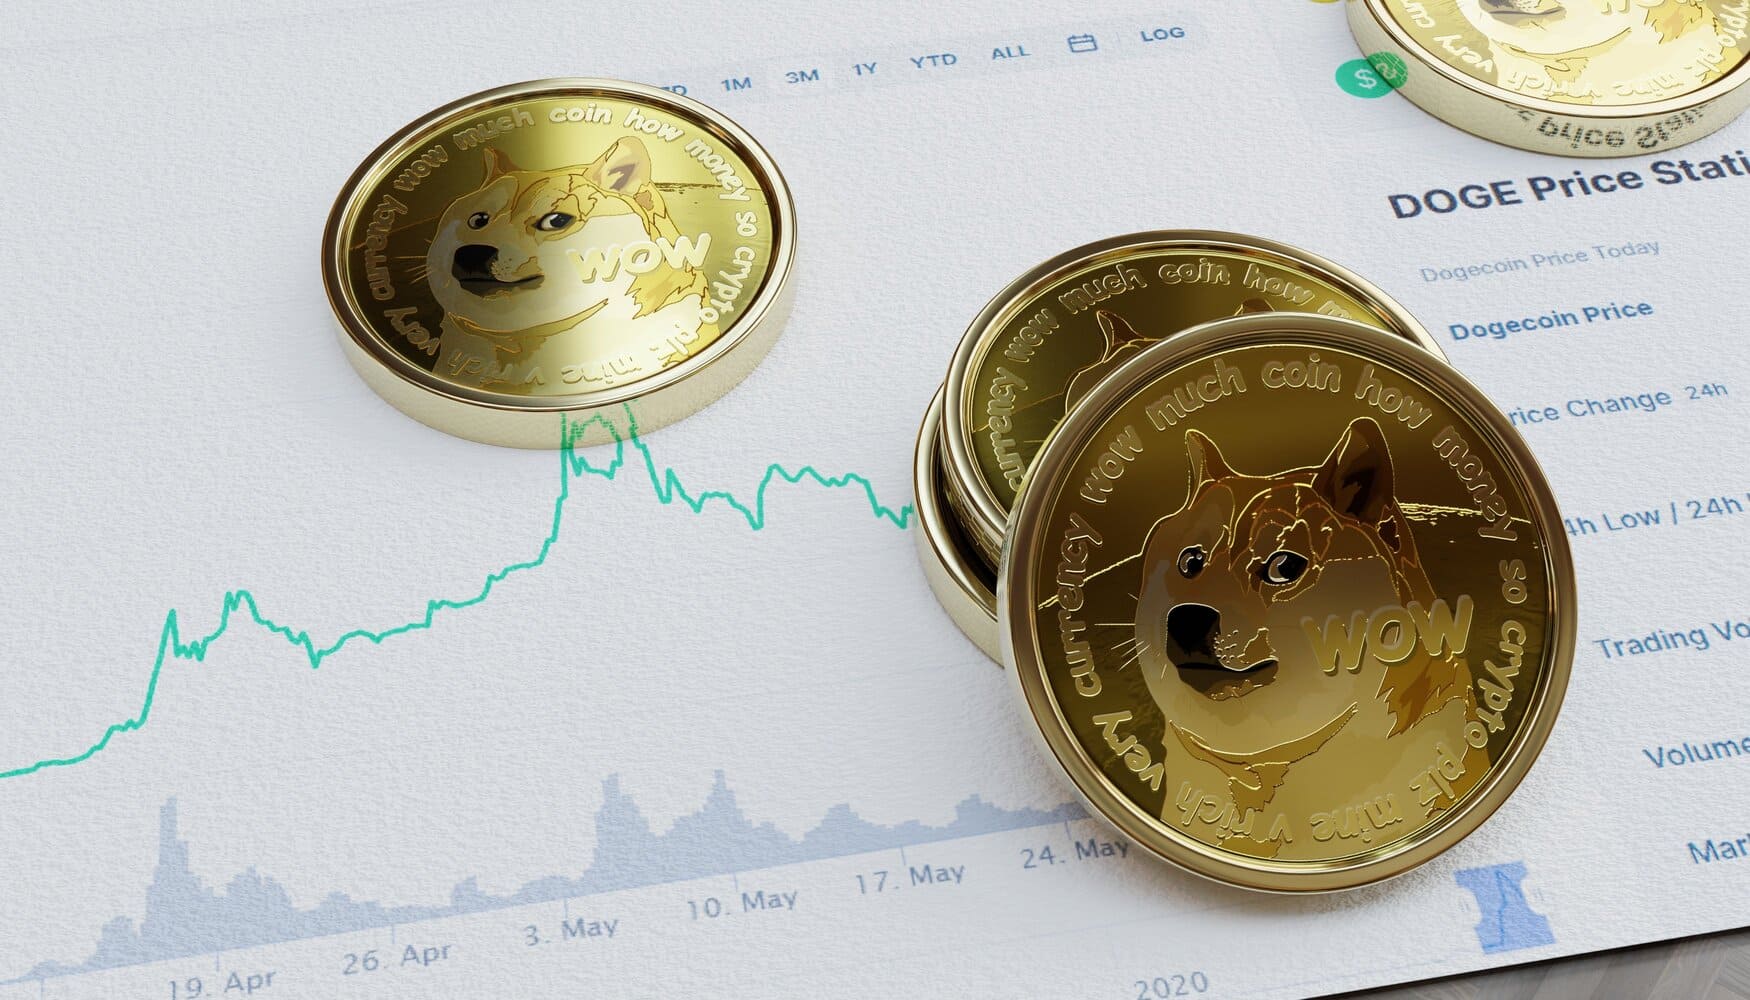
- Crypto Market Metrics
- Crypto Fear & Greed Index
- On-Chain Metrics
- 2. Psychological Approach to Market Volatility
- The Psychology of the Red Candle
- Managing Impulses
- Cognitive Biases
- Manage Your Risk
The characteristic volatility of the crypto market makes price movements opportunities for
profits or losses, depending on your sentiment and risk management. It is clear that traders
will not always be on the right side of price movements, as prices move despite sentiment.
However, it is important to know how to read market volatility and manage trends without
ending the day in the red.
Why Does Volatility Matter Anyway?
Volatility is a measure of the speed and degree to which prices move in a market. Volatility is one of the most important concepts in any financial market. This is because asset prices only move when traders buy, sell, or exchange them, creating liquidity. and driving volatility higher or lower.
High volatility on a crypto trading platform means fast price movements, higher risk, and a better potential for profits or losses. Low volatility, on the other hand, indicates smaller price movements and more stability. When traders read volatility, they gain insights into the market's state and can determine whether there is panic and uncertainty or calm confidence.
And since volatility moves in cycles of low and high volatility, which different assets exhibit to varying degrees, traders can find opportunities that fit their portfolios and trading plans, and manage their traders accordingly. But it all depends on how well you can read volatility.
How to Read Market Volatility
There are two broad approaches to market volatility: technical analysis and psychological techniques. As a trader, your psychology must complement your technical analysis to give you that profitable edge. This is because sentiments are driven by how traders perceive news and how they react in the market.
1. Technical Analysis
Volatility is a technical metric, and that is why technical analysis is the first approach to reading it. There are three techniques, usually combined, to achieve this.
Top-Down Analysis
- In top-down analysis, traders examine charts from higher to lower timeframes. This is because markets are fractional, meaning that price movements on higher timeframes repeat in lower ones. When this happens, a candlestick on a 4-hour, daily, or weekly chart shows a bearish or bullish move, which also shows up on the 1-hour and minute charts. When you analyze charts from higher to lower timeframes, you can easily identify strong trends and areas of sharp drops and minor retracements. For example, major resistance and support levels on the Bitcoin chart are price magnets that attract high volatility.

Technical Indicators
Indicators are another set of tools that you can use to measure volatility on the charts. Indicators are considered more comprehensive and direct than charts, because they use mathematical equations to generate visual reports. Two of them, the Average True Range (ATR) and the Bollinger Bands, are widely used. You can also use the Relative Volatility Index (RVI) and the Relative Strength Index (RSI) to measure volatility.
Historical volatility
This is another simple technique you can use to measure volatility. Check past price movements over a specific period, such as 30 or 90 days, and calculate volatility using the standard deviation formula. If the volatility is below 23, between 23 and 30, or above 60, it is low, high, or extreme volatility, respectively.
Crypto Market Metrics
Another way to measure crypto volatility is by tracking specific metrics. There are two of them that you can use:
Crypto Fear & Greed Index
The Fear & Greed Index analyzes market sentiment from real-time and historical data. The Index is compiled by various data aggregators, and the score ranges from 0 to 100, with lower values indicating extreme fear and higher values indicating extreme greed. You can gain insights into what investors are thinking about the market at a glance. And when combined with on-chain metrics, you can easily identify volatility and where it is moving.
On-Chain Metrics
Blockchains record verifiable, quantifiable data that point to market sentiment, user activity, network health, etc. Some of these data are the active addresses, transaction volume, total value locked (TVL), exchange flows, and wallet activity. With this data, you can build a story of where and how funds are flowing, and, through that, determine whether volatility is high or low.
For example, Ethereum might be on a bullish trend, while on-chain data shows that whales like Michael Saylor's Strategy and BlackRock are buying more Bitcoin. This can tell you where volatility is likely to move in the coming days.
You should also combine on-chain metrics with off-chain data, such as high-impact news, e.g. a major rate cut announcement or new digital asset regulations in a leading crypto country.
2. Psychological Approach to Market Volatility
Managing your psychology when trading a volatile market is important if you don’t want to ruin your day with every red candle. How you react is just as important as the trades you take. There are several aspects of managing your psychology.
The Psychology of the Red Candle
Most traders associate red candles with losses and drawdowns because most trading platforms use the default green and red colors for bullish and bearish candles. It is easy to subconsciously think of losses when red candles appear, and this could ruin your response. It is better to change your color scheme and use other colors, preferably dull ones, so your brain can concentrate on the candle rather than the color.
Managing Impulses
A developed emotional intelligence (EQ) is what separates profitable traders from those who succumb to their impulses. Build self-awareness, visualize worst-case scenarios, and practice objective reframing to unlearn how you see negative volatility. Practice de-escalation and implement rules that eliminate the need for emotional decisions.
Cognitive Biases
Identify and learn to avoid cognitive and emotional biases that affect how you process information when investing. For traders, these usually include loss aversion, recency bias, herd mentality, and price anchoring. Identify the triggers and learn to isolate them before you act.
Manage Your Risk
Risk management helps you reduce losses and maximize returns. You should automate stop-loss, take-profit, and trailing-stop orders, use price alerts instead of spending more hours on-screen, and trade with 1-2% of your capital to manage volatility. Take calculated risks and always protect your capital.


